[ Home | Task | Process |Conclusion | Content Standards | Credits ]
 Have
you ever watched the evening news with your folks and wondered how the
weather person could have been so wrong? You wore shorts to school that
day only to find yourself freezing during lunch. Predicting the
weather is a very difficult task. The many factors which impact your daily local
weather can be thousands of miles away, so Meteorologists use a variety
of different remote tools including satellites and buoys to help them make
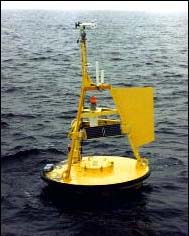
predictions. The buoy to the right is an example of a tool used
by scientists. These experts make their predictions by building
models using historical and current data. Have
you ever watched the evening news with your folks and wondered how the
weather person could have been so wrong? You wore shorts to school that
day only to find yourself freezing during lunch. Predicting the
weather is a very difficult task. The many factors which impact your daily local
weather can be thousands of miles away, so Meteorologists use a variety
of different remote tools including satellites and buoys to help them make
predictions. The buoy to the right is an example of a tool used
by scientists. These experts make their predictions by building
models using historical and current data.El Niño and La Niña cycles are examples of these complex patterns. In this investigation, you will learn more about El Niño and La Niña cycles, and how they impact the weather in your area. To accomplish this task, you will be logging into one of same ocean buoys that scientists use to develop their models. You will be part of an expert team. Your team will be responsible for collecting data, organizing it in an appropriate graphic form, and analyzing it for the purpose of making weather predictions in your community. After making your prediction, you will write a speculation paper that details how you reached your conclusion. Your last task will be to share your findings with the scientific community. As winter approaches, you will be on the hot seat, and you’ll get a taste of what it's like to be a weather person. To be successful, you need to ask great questions, seek out the answers, develop new relationships, and take a stand.
Step 1: In the news El Niño and La Niña cycles have a tremendous impact on the world's weather. It is hard to believe that ocean water temperatures in the Pacific Ocean can impact mid-America states, but the national news organizations have reported on the extensive impact of the cycle. Read the two articles below, and write a short summary of each one.
Step 2: Background information Split up and assign each member of your group one of the Web pages listed below. After exploring the Web pages individually, get back together in your group and answer the following questions.
Resources
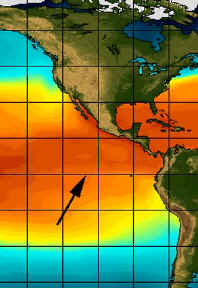
Step 3: Real-time data It's time to start gathering sea surface temperatures (SST), so your team can begin to build a useful model. You will be using a buoy located at 110 degrees West and 0 degrees North. You will begin by gathering today's real-time data, and then adding that value to the temperatures for the last 14-days.
Step 4: Historical model Scientists have been tracking SST for many years, and it has allowed them to create a historical model that helps them predict El Niño and La Niña cycles. Use the link below to answer the following questions:
Historical Anomaly Graph - TOA/TRITON Step 5: Temperatures and participation The buoy we have been tracking is several thousand miles away, so it is hard to believe that sea surface temperatures can have an impact on your local weather. Use the links below to investigate how the El Niño and La Niña cycles impact your local weather. You may want to split up the links between each of your team members, and allow each individual to become a site expert. Be prepared to use this information when you write your final speculation paper.
Step 6: Speculation It's time for you to take a stand. The model you developed in step 5 was only for a 15-day period, so you may also want to extend your graph to include a longer period of time. You can access additional SST by visiting the TOA / TRITON Data Delivery System. (Note: Make sure you are gathering data from the correct buoy.) Is the world currently in an El Niño or La Niña cycle? What are your predictions for temperature and precipitation in your local area? You will be required to provide solid support when making your case. Your group needs to work together to reach consensus. After your group has reached consensus, your task is to construct a solid speculation essay, so you may want to read a few Tips on Writing Speculation Papers. Step 7: Share your prediction Your last step is to share your speculation with the world. Access the Climate Prediction Center Feedback Form, and cut and paste your paper into the form. Maybe you'll hear back. Be sure to use the grading rubric as a guide. Good Luck! Remember, luck only occurs where opportunity and preparation meet. Read, write, gather data and create your model with care. This winter you may actually live out your speculation. |
Last Updated September 2000
For more information, contact pusdhelp@sdcoe.k12.ca.us
 THE
PROCESS
THE
PROCESS