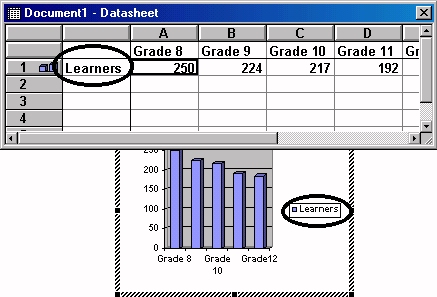
In this example we will create
a graph showing the learners in the different grades in the
school.
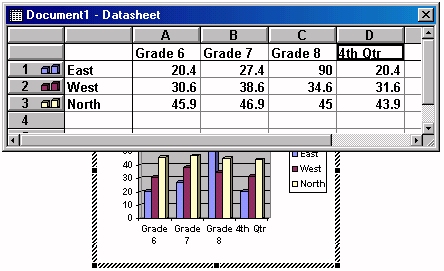
In the first row below the
headings A - D, enter the names of the grades.
Watch what happens to the graph
as you enter data into the datasheet.
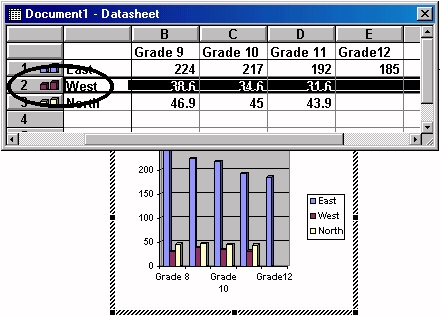
Do the same with the 3. Watch
what happens to the graph.