In this example we will create a graph showing the learners progress in the different grades in a school.
Microsoft Word 2007 - Graphs (Creating a graph) |
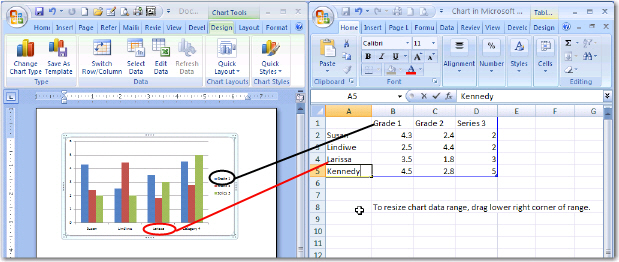
In this example we will create a graph showing the learners progress in the different grades in a school. In the first row below the headings B - D, enter the names of the grades. Watch what happens to the graph as you enter data into the datasheet. Notice how the legend updates to the new information.
In the first column enter the names of learners. Notice that the names appear on the horizontal (X) axis.
|
Copyright
Microsoft, SchoolNet SA All Rights Reserved. |