The best way to learn graphing with Word is to experiment with graphing.
Microsoft Word 2007 - Graphs (Formatting a graph) |
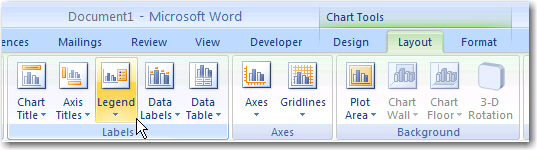
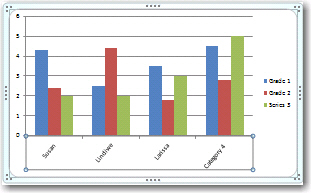
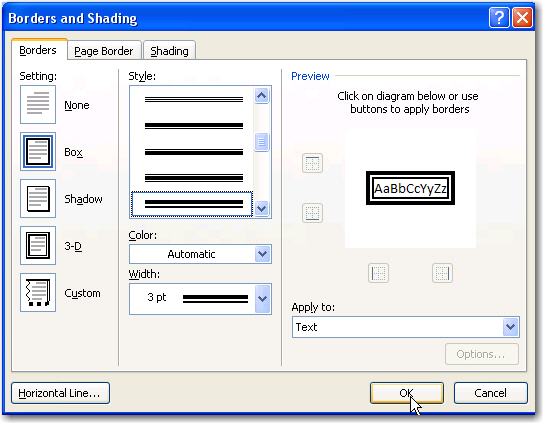
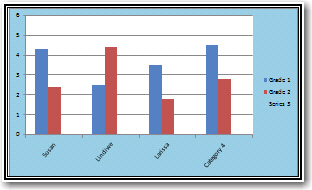
The best way to learn graphing with Word is to experiment with graphing. The meaning of graphs can be enhanced with legends or labels and formatting such as types of graphs, alignment of labels, meaningful colour of columns, background colours and by adding a border. To add legends (labels) click on Chart tools , then select the Layout tab and click Legend.
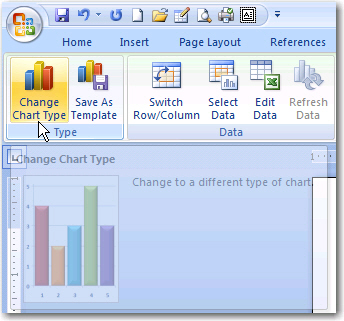
To change the type of graph click on Chart tools, then select the Design tab and click
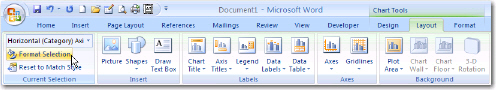
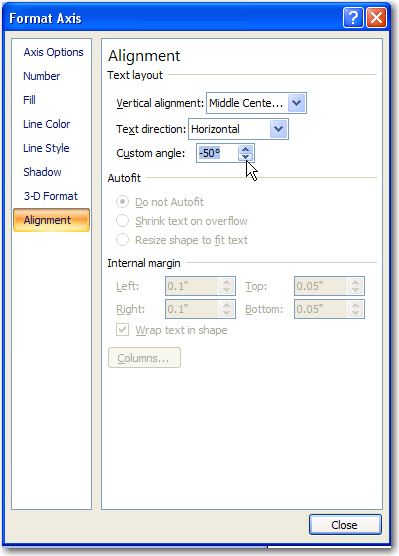
Click on Format Selection on the Layout tab. Then select Alignment.
Change the degrees in the custom angle bar. In this example it has been changed to -50 degrees.
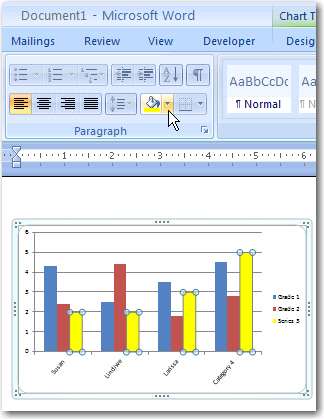
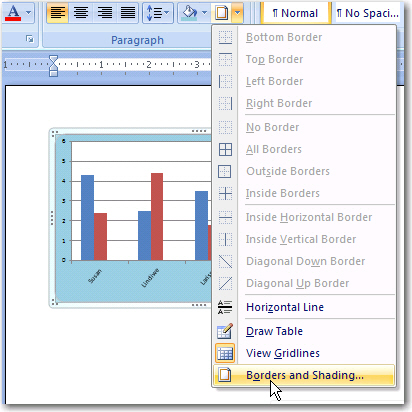
To change the colour of the columns,
activate the graph by double clicking it. Click on the
column whose colour you wish to change. Select the Home tab, then click on the fill colour icon
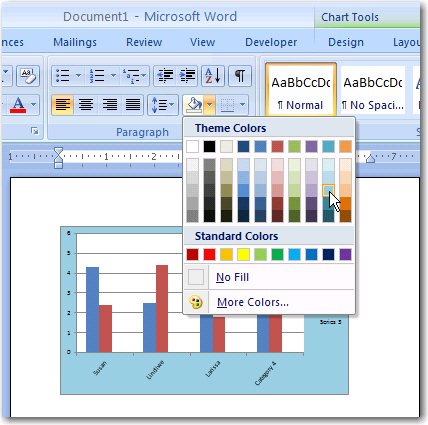
Then click the Home tab and select a new fill colour
|
Copyright
Microsoft, SchoolNet SA All Rights Reserved. |