Microsoft Word 2007 - Inserting a graph
To insert a graph or chart in a Word
document
On the Insert tab, click Chart found on the Illustrations group.
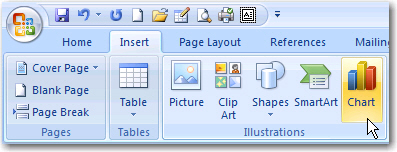
Select a chart type.
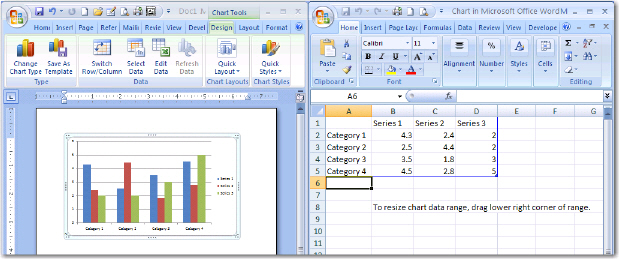
A graph is automatically created.
Notice: A word document and spreadsheet open side by side. You are able to update data on the spreadsheet and immediately see the changes in the chart .
You need to change the labels (series names) and values (numbers) in the table to create your own graph.
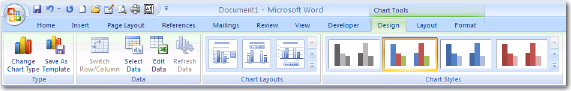
Once you insert the chart, you will notice the new toolbar with three additional chart tools tabs. Design, Layout and Format. These tabs provide options for you to change the chart type, data, chart layout etc.
Copyright
Microsoft, SchoolNet SA
All Rights Reserved.
All Rights Reserved.