Microsoft Excel 2007 - Creating graphs or charts
How to create a chart or graph
Spreadsheets refer to graphs as charts-both refer to one and the same thing
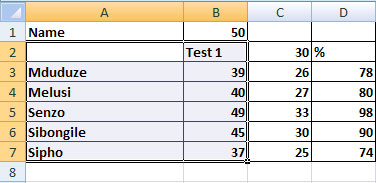
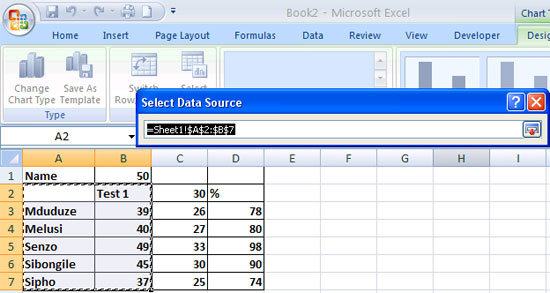
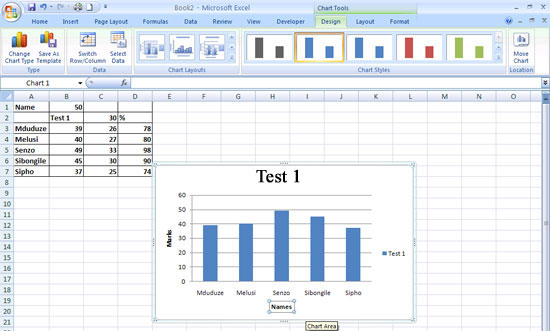
Before drawing the graph you have to select the information you wish to graph. It would save time if you could also select the associated labels, as shown in the image below - the labels for the column data (Test 1) and Names have been included in the selection.
Click the Insert tab, the Charts group (highlighted below) will display a few commonly used chart types.
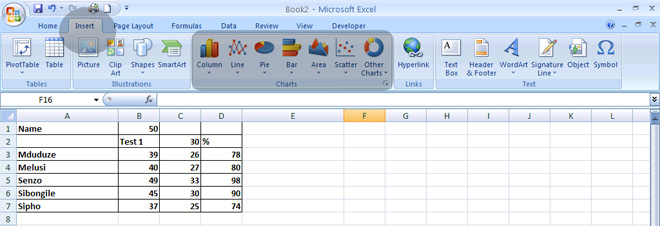
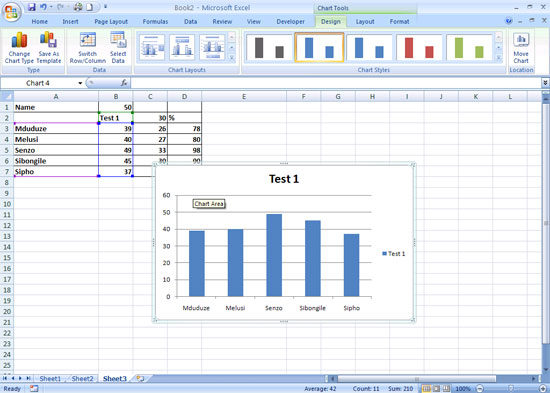
Select the data you want ot graph, then click on the most suitable chart type. Your chart will appear in a separate window in the active sheet.
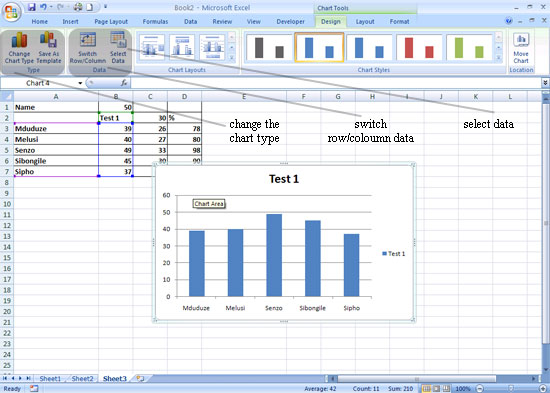
If the graph does not look as you want it to, you can do the following:
-
select the Types group and then select another type of graph.
-
switch the row/column data
-
reselect data by clicking select data
How to Change the Chart type
Changing the Chart type is as easy as selecting the Change chart type icon and slecting the new type of chart.
How to Change the Data Source
Click the Select Data icon (see above)
In the chart data range bar, Sheet1! is the file name (the file had not been saved at that stage). $A$2 is the cell reference for A2. It is what we call an absolute cell reference (with the $ signs). An absolute cell reference does not change when a formula is copied. $A$2:$B$7 means that all data in the cell range A2 and B7 are currently on the graph.
Select the red arrow ![]() on the chart data range bar.
on the chart data range bar.
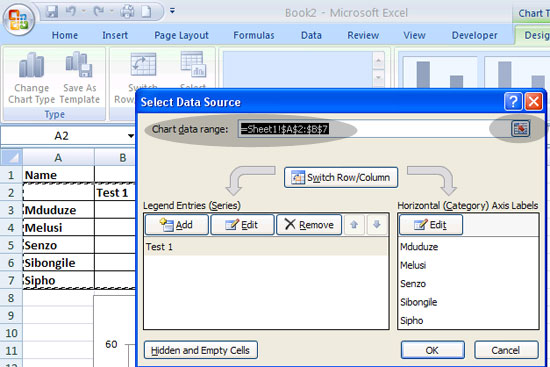
The Select Data Source window becomes smaller. Now all you need to do is select the new data range and click the red arrow ![]()
You are also able to add, edit or remove legend labels in the above window. Click OK to see the updated chart.
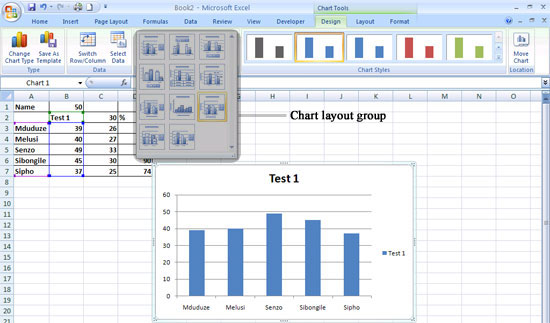
How to change the Chart layout
The Chart layout group allows you to choose a pre-defined layout for the chart. Select the chart layout tab to see what options are available.
Layout 9 for instance allows you to insert x and y -axis labels.
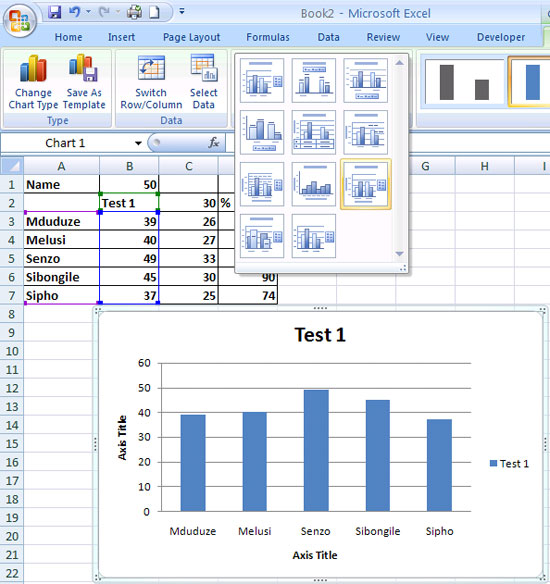
You can edit the chart title, and labels for the y-axis (side) and x-axis (bottom). The labels (NAMES and MARKS) have been entered in the example below.
You can also move the chart to another location by selecting Move Chart on the menu.
All Rights Reserved.