You will work with an assigned partner to
complete this project. Three class periods will be allotted to work on the
project. If additional time is needed to complete the project, you and
your partner are expected to do this work outside of class.
The following list suggests steps you and
your partner can take to complete the project.
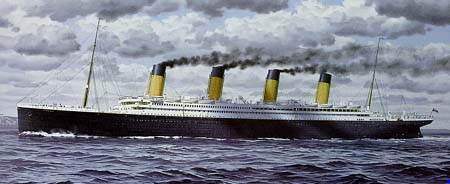
- Review some of the background information
on the Titanic, its voyage, its passengers, and its crew. This will help
to give life to the statistical research you will do in the
project.
- Explore a database of information on the
passengers and crew of the Titanic. The suggested site actually has two
databases, one for passengers and one for crew. Use the "Instructions
for searching" link on each page to view the explanation of fields on
each database. Pose questions to see what you can find here: Did any
survivors share the same last name as you or your partner? How many
children were on board? What percent of crew members survived? What
nationalities were represented on the ship?
- Using the database as a source, construct
spreadsheet tables with appropriate graphs to illustrate each of the
following statements about the titanic tragedy:
- More men survived than women.
- The rule "women and children first" was
followed in loading the lifeboats.
On your spreadsheet, include an explanation of how
the statistics can support these seemingly opposite statements. Turn in
a copy of this completed spreadsheet to the instructor. (Make sure your
name and your partner's name are on the sheet!)
- Using the database as a source, construct
spreadsheet table(s) with appropriate graph(s) to illustrate a topic of
importance to you and your partner. Some possible ideas are focusing on
percentage of survivors by class and/or gender and/or age ranges and/or
nationalities. You may also focus on statistics for a specific group of
people (women, children, or crew). These are simply examples; be
creative and decide on a topic of your choice.
- Prepare a 5 minute computer generated
slide show presentation for class (6-10 slides) on the results of your
webquest. Include one or two historical facts that you and your partner
found interesting about the ship, voyage, passengers, and/or crew. Then
move on to the research topic you selected. Include reasons for your
topic choice, your data table(s) with chart(s) or graph(s), and your
insights, explanations, conclusions, and/or comments. Turn in a handout
copy of the slides of your presentation with a list of the references
you and/or your partner used in completing the webquest. For each
reference used, write a sentence or two describing how it helped you
complete the webquest.
Return
to Top | Other
LSU Webquests |