|
|||||||||||||||||
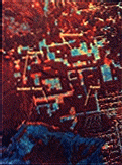
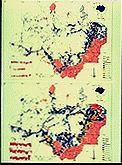
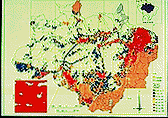
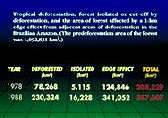
The Earth Observing System Educators' Visual Materials [Table of Contents] [Previous] [Next] ID: 4-07 a,b,c,d Tropical Deforestation and Habitat Degradation In the Brazilian Amazon Basin 1The Brazilian Amazon is the largest continuous region of tropical forest in the world, containing nearly 31 percent of the world total. Tropical deforestation is a major component of the carbon cycle and has profound implications for biological diversity. Deforestation increases atmospheric carbon dioxide (CO2) and other trace gases, possibly affecting climate. Conversion of forests to cropland and pasture results in a net flux of carbon to the atmosphere because the concentration of carbon in forests is higher than that in the agricultural areas that replace them. Furthermore, while occupying less than 7 percent of the terrestrial surface, tropical forests provide homes to half or more of all plant and animal species. The primary adverse effect of tropical deforestation is massive extinction of species including, for the first time, large numbers of vascular plant species. Deforestation affects biological diversity in three ways: (1) destruction of habitat, (2) isolation of fragments of formerly contiguous habitat, defined as areas of less than 100 square kilometers surrounded by deforestation, and (3) edge effects within a boundary zone between forest and deforested areas, defined as 1 kilometer into the forest from adjacent areas of deforestation. In the boundary zone there are greater exposure to winds; dramatic micrometeorological differences over short distances; easier access for livestock, other nonforest animals, and hunters; and a range of other biological and physical effects. The result is a net loss of plant and animal species in the edge areas. Spatial analysis of the geometry of deforestation is critical to the estimation of forest isolation and the edge effect. If 100 km2 of tropical deforestation occurs as a 10 km by 10 km square and we assume that the edge effect is 1 km, the total area affected is approximately 144 km2. In contrast, if the 100 km2 of deforestation is distributed as 10 strips, each 10 km by 1 km, the affected area is approximately 350 km2. An analysis of change over a 10-year period of the entire Brazilian Amazon area was performed using Landsat data. For 1988, 210 black and white photographic images from the 1.55-to-1.75 micrometer channel of the Landsat Thematic Mapper, with a ground resolution of about 30 meters, were obtained. The deforested areas were digitized with visual deforestation interpretation and standard vector geographic information system (GIS) techniques. Image 4-07a is a Landsat Thematic Mapper color composite image of southern Rondonia state, Brazil, and illustrates this type of analysis. Taken on June 5, 1988, this image shows areas of tropical forest, deforestation, regrowth, and isolated forest. The area labeled as "isolated forest" is about 3 km by 15 km in size. To determine the extent of deforestation in 1978, maps produced from single (visible) channel Landsat Multispectral Scanner (MSS) data were digitized. The ground resolution of the MSS channel was about 80 meters. Image 4-07b shows the distribution of deforestation in the Amazon Basin for 1978 (top) and 1988 (bottom). The data were averaged into 16-km-by-16-km grid cells, an example of which is shown in each figure. The broad areas in the east and south, color-coded brown, indicate "cerrado" or savanna (tropical grassland containing scattered trees and drought resistant undergrowth). Image 4-07c shows where biological diversity was adversely affected in 1988 by deforestation, isolation of forest, and the 1-km edge effect from adjacent areas of deforestation. The affected-habitat data were averaged into 16-km-by-16-km grid cells. The numerical results of the analysis are shown in 4-07d. Deforestation increased between 1978 and 1988 (78,000 to 230,000 km2) as did the total affected habitat (208,000 to 588,000 km2). About 5.6 percent (230,324/4,092,831) of closed canopy forest had been cleared as of 1988 and about 14.4 percent (587,604/4,092,831) of the forested. Amazon was affected by deforestation-caused habitat destruction, habitat isolation, and edge effects. The preponderance of affected habitat results from proximity to areas of deforestation (approximately 341,000 km2 for a 1-km edge-effect) and not from isolation of forest (approximately 16,000 km2) or deforestation per se (approximately 230,000 km2). While the rate of deforestation averaged approximately 15,000 km2/year [(230,324 - 78,268)/10] in the Brazilian Amazon from 1978 to 1988, the rate of habitat fragmentation and degradation was approximately 38,000 km2/year [(587,604 - 208,229)/10]. Implications for biological diversity are not encouraging and provide added impetus for the minimization of tropical deforestation in the future. MTPE's future plans include continuing analyses using data from such instruments as the Enhanced Thematic Mapper (ETM), scheduled for flight on Landsat-7, and the Advanced Spaceborne Thermal Emission and Reflection Radiometer (ASTER), provided by Japan and scheduled for flight on an EOS satellite. |
|||||||||||||||||

 4-07a
4-07a 4-07b
4-07b 4-07c
4-07c 4-07d
4-07d